Revision Maths Online:
Picture Graphs 2550
Line Graphs 2552
Column Graphs 2554
Line Graphs 2660
Sector (Pie Graphs) 2662
Line Graphs 3334
Stem and Leaf Plot 4327
Pie Graph 3335
Picture Graphs 2550
Line Graphs 2552
Column Graphs 2554
Line Graphs 2660
Sector (Pie Graphs) 2662
Line Graphs 3334
Stem and Leaf Plot 4327
Pie Graph 3335
Other Revision:
Stem & Leaf Plots: Worksheet (Out the front of the room)
Mean, Median, Mode & Range: Colour By Number (Out the front of the room)
Bar Graphs: Use the Data Below and Graph In Your Grid Book
Remember:
You MUST use a ruler and you also need to include the following:
-title
-labelled axes - (x = horizontal, y = vertical)
-colour
Remember:
You MUST use a ruler and you also need to include the following:
-title
-labelled axes - (x = horizontal, y = vertical)
-colour
Wednesday 27th June
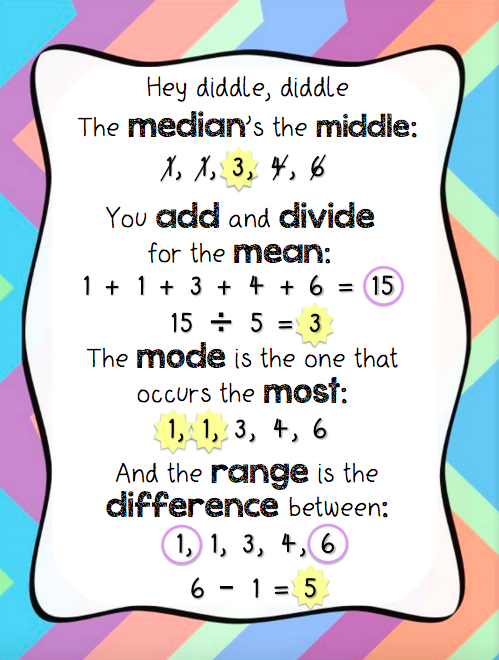
LI: We are learning to calculate mean, median, mode and range for sets of data.
SC: I can interpret a set of data by calculating the mean, median, mode and range.
LI: We are learning to calculate mean, median, mode and range for sets of data.
SC: I can interpret a set of data by calculating the mean, median, mode and range.
Group 1: With Mr Blain
Jess, Emz, Jack, Tahlia, Paddy, Connor
Group 2: Working Independently
Everyone else
Everyone else
Then:
Tuesday 26th June
LI: We are learning to calculate mean, median, mode and range for sets of data.
SC: I can interpret a set of data by calculating the mean, median, mode and range.
LI: We are learning to calculate mean, median, mode and range for sets of data.
SC: I can interpret a set of data by calculating the mean, median, mode and range.
Introduction:
Find the range, median, mode & mean.
1: 1, 3, 4, 8, 8, 6, 5
2: 7, 9, 8, 7, 4
3: 4, 6, 8, 9, 5, 4
Find the range, median, mode & mean.
1: 1, 3, 4, 8, 8, 6, 5
2: 7, 9, 8, 7, 4
3: 4, 6, 8, 9, 5, 4
Activity:
Escape Room Challenge
Escape Room Challenge
Monday 25th June:
LI: We are learning to calculate mean, median, mode and range for sets of data.
SC: I can explain what the mean, median, mode and range are, and how to calculate them.
LI: We are learning to calculate mean, median, mode and range for sets of data.
SC: I can explain what the mean, median, mode and range are, and how to calculate them.
Stem & Leaf Plots From Last Week:
Calculate the Mean, Median, Mode & Range of the Active Heart Rate Stem & Leaf Plot.
Calculate the Mean, Median, Mode & Range of the Active Heart Rate Stem & Leaf Plot.
Monday 25th June:
LI: We are learning to calculate mean, median, mode and range for sets of data.
SC: I can explain what the mean, median, mode and range are, and how to calculate them.
LI: We are learning to calculate mean, median, mode and range for sets of data.
SC: I can explain what the mean, median, mode and range are, and how to calculate them.
Warm Up:
Maths War or Pacman?
Maths War or Pacman?
Introduction:
Student Activity:
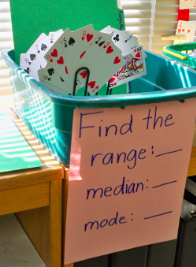
Use sets of playing cards like in the picture above. Have students rule up a page in their Maths books showing:
Data: Median: Mode: Range: Mean:
(NB: there may not be a mode, if there are no double ups of numbers!)
Work through several sets with the students until they are confident to continue in pairs or a small group together.
Working with Mr Williams:
Logan, Nakita, Erika, Aiden, Jarvis
Thursday 21st June:
LI: We are learning to describe and Interpret different sets of data in the form of a Stem and Leaf Plot
SC: I can read and interpret a Stem and Leaf Plot.
LI: We are learning to describe and Interpret different sets of data in the form of a Stem and Leaf Plot
SC: I can read and interpret a Stem and Leaf Plot.
Warm up:
Snake or Maths War? (Vote)
Snake or Maths War? (Vote)
Introduction:
How many times will your heart beat today?
A thousand/ more than ten thousand/ more than a million?
How could you work this out?
How could you work out how many times your heart beats in a minute?
A thousand/ more than ten thousand/ more than a million?
How could you work this out?
How could you work out how many times your heart beats in a minute?
Student Activity:
- Work with a partner. Count the beats for 15 seconds and then multiply by 4.
Draw a stem-and-leaf graph on a chart or the board.
What do both sides of the stem & Leaf chart represent?
Now get the students to add their pulse rates on the graph. If the students have not put the ones digits in order then this needs to be discussed and then changed.
Look at the stem-and-leaf graph and discuss.
Which is the most popular decade?
Could you tell without counting the number of digits on each leaf? (This is where the similarities between stem-and-leaf and bar charts can be made.)
Which pulse is near the middle? (Stem-and-leaf graphs are great for answering this question as you can count in from either "end" of the data)
Which pulse rates are grouped together in clusters?
Which pulse rates are lying outside the cluster?
Discuss the factors which cause pulse rates (heart beats) to vary.
Now send the students out for a two minute fitness run. Take their pulse again and put the figures on the other side of the graph. Get the students to make statements about the data they collected;
Are there any surprises?
What are the differences between the two sets of data.
Get the students to make observations about the data.
Thursday 21st June (Lesson 2):
LI: We are learning to pose and refine questions to collect categorical or numerical data by observation or survey
SC: I can ask specific questions and use the data to create a graph
LI: We are learning to pose and refine questions to collect categorical or numerical data by observation or survey
SC: I can ask specific questions and use the data to create a graph
Next week we will be having a paper plane flying contest.
What features would a plane that can fly a long way have?
If you were to make a plane to fly a long way what would you need to consider?
How might our paper plane competition run?
Which units of measure, millimetres, centimetres of metres would be most appropriate? Why?
Which units allow for the greatest accuracy? Why?
Now we need to make a set of criteria around how our paper planes can be built:
- A4 Paper
- What else?
Allow students time with paper to carry out initial experiments with planes and then brainstorm their ideas about features that affect the distance a plane will fly, get them to record these findings down in their books. Discuss these features and introduce the word variable.
http://www.paperairplanes.co.uk/planes.html - a variety of simple planes made from A4 paper with clear instructions
http://www.zurqui.co.cr/crinfocus/paper/airplane.html - detailed instructions on how to make an elaborate paper plane
http://bestpaperairplanes.com/ - a variety of simple planes with clear instructions
Wednesday 20th June:
You MUST use a ruler and you also need to include the following:
-title
-labelled axes - (x = horizontal, y = vertical)
-colour
You MUST use a ruler and you also need to include the following:
-title
-labelled axes - (x = horizontal, y = vertical)
-colour
Tuesday 19th June:
LI: We are learning to understand the features of a graph.
We are learning to describe and Interpret different sets of data in the form of a Bar Graph
SC: I can explain what the features of a graph are.
I can read and interpret a Bar Graph.
Warm Up:
SNAKE
Introduction:
Display this document of graphs on the IWB.
As you look at each graph, discuss with students what features they all have.
eg:
-title
-labelled axes - (x = horizontal, y = vertical)
-key
-colour
What information can we get from these graphs?
Student Activity:
The first type of graph we will be looking at is a Bar graph.
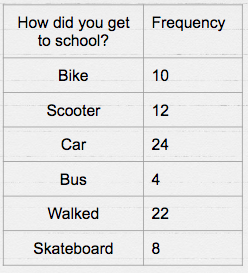
Bar graphs compare the frequency of data. Data are displayed using a number of rectangles (bars) that are the same width. Each bar represents one of the categories that the data have been sorted into. The bars are displayed either horizontally or vertically with a space between them.
Sometimes you will see Double bar graphs which are used to make comparisons between and among sets of data.
Student activity:
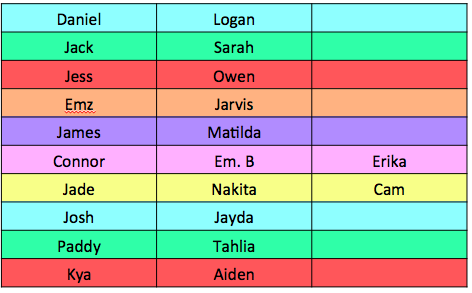
I want you to write down your full names (first and last). Once you have finished I want you to count the number of letters in your name.
I will collect the data on the board based upon the amount of letters in the name. Once the data is on the board, I want you to create a bar graph (Vertical or horizontal) based upon the information collected.
You must use a ruler!!
The key things you need to include are:
· Title
· labeled x and y axis,
· scale is equal and starts at zero,
· correct bar heights,
· bars not connected
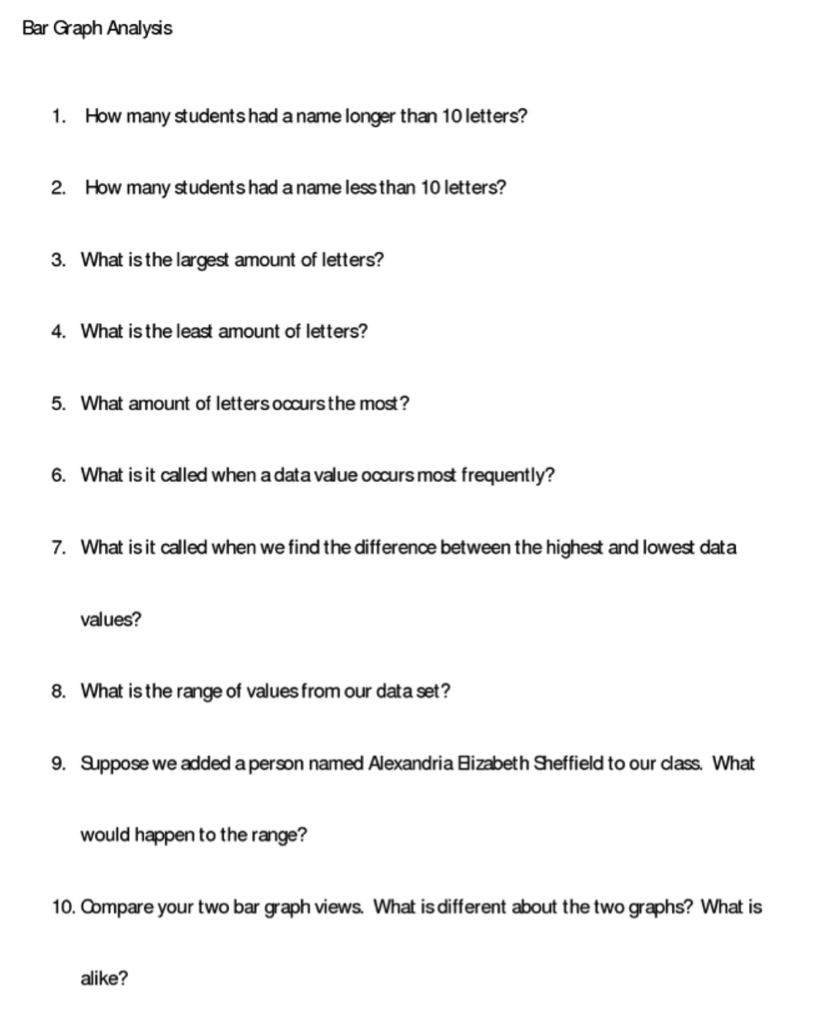
When you finish your bar graphs, use the bar graph worksheet below to answer questions about the data (Answer using full sentences).
The first type of graph we will be looking at is a Bar graph.
Bar graphs compare the frequency of data. Data are displayed using a number of rectangles (bars) that are the same width. Each bar represents one of the categories that the data have been sorted into. The bars are displayed either horizontally or vertically with a space between them.
Sometimes you will see Double bar graphs which are used to make comparisons between and among sets of data.
Student activity:
I want you to write down your full names (first and last). Once you have finished I want you to count the number of letters in your name.
I will collect the data on the board based upon the amount of letters in the name. Once the data is on the board, I want you to create a bar graph (Vertical or horizontal) based upon the information collected.
You must use a ruler!!
The key things you need to include are:
· Title
· labeled x and y axis,
· scale is equal and starts at zero,
· correct bar heights,
· bars not connected
When you finish your bar graphs, use the bar graph worksheet below to answer questions about the data (Answer using full sentences).